Built For Everyday Users: Microsoft BI Tools For Data Analytics

Microsoft Power BI is a business intelligence tool that is one component of Microsoft’s expanding Power Platform. It functions as a collection of software services, apps, and data connectors that work seamlessly to create a unified vision of an organization’s business data into coherent, visually immersive, and interactive insights and data analytics. The enterprise data may reside in an Excel spreadsheet, legacy database, or a combination of cloud-based and on-premises hybrid data sources.
Microsoft has positioned Power BI as a self-service tool that allows business users and IT resources to rapidly build and deploy reports, dashboards, and apps with limited ramp-up time. The visualizations and analytics produced by the tool can be utilized by an organization to identify trends and outliers in large data sets and facilitate business decisions in an accelerated manner.
What Can Power BI Do For Your Company?
Power BI is more than reporting and analytics. Power BI can help your business users gain valuable information about your organization’s data. From profiling data quality to identifying the distribution of key data points, Power BI provides functions that allow those closest to the data to better understand how to share key data across the enterprise.
Creating stunning visualizations is where Power BI comes alive. The common visualizations are front-and-center:
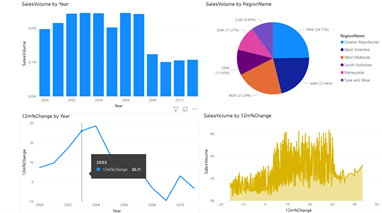
- Bar and column charts
- Single-, multi-line charts
- Area charts
- Pie and donut charts
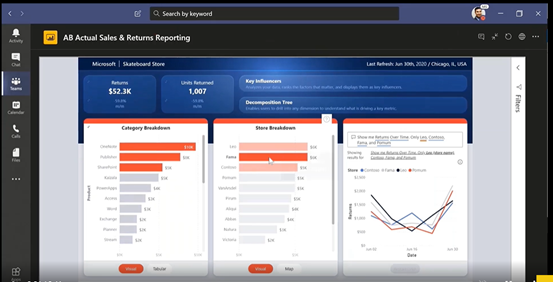
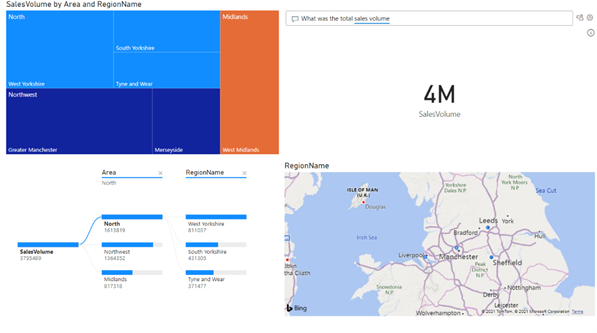
Power BI also provides visual tools to help you find the root cause of a drop in sales or the breakdown of geographically dispersed data (either plotted on maps or in easy-to-read graphics). Power BI even allows users to ask questions about the data and build additional visuals from the questions and answers.
Power BI’s Quick Insights feature uses advanced analytical algorithms to generate a set of analytical visualizations based on imported data. These Quick Insights visualizations identify trends and outliers that aren’t evident in graphics built by a developer or business user. In addition to the Quick Insights feature, Power BI supports artificial intelligence capabilities that utilize text and vision analytics for functions such as key phrase extraction, score sentiments, and image tagging.
An organization will benefit from these Power BI features by improving the accuracy and timeliness of data while creating powerful insights that can be used to make informed business decisions.
Power BI Ease Of Use
One of the strengths of Power BI is the ease of use that allows non-technical users to rapidly import data into Power BI Desktop and subsequently build meaningful visualizations, which can then be deployed and accessed by decision-makers in the organization.
- Built-in data connectors support data importing without having to install drivers or write code. After the data is imported, the Power Query Editor facilitates data transformations to shape the data as needed.
- Users can rapidly build report visualizations via drag-and-drop by selecting a combination of data elements and visual objects. Power BI will determine the default visualization to use based on the data context. For example, dragging city, state, or latitude/longitude data fields will automatically select the map visualization if the field is geocoded.
- Reports developed in Power BI Desktop can be published to the Power BI Service, a cloud-based site where dashboards with alerts and apps can be built and shared with a group of users based on defined security roles.
- Mobile-specific layouts can be created from the Power BI Desktop and viewed on IOS and Android devices using the Power BI Mobile app.
How Can Opportune Help With Your Business Intelligence & Reporting Needs Using Tools Like Power BI?
Opportune LLP’s Process &Technology group can provide consulting services to help your organization make better business decisions based on an embedded data culture. Whether utilizing Power BI or other tools to bring business insights to the forefront, Opportune has the expertise to put the best data in the right hands for better business decision-making. The following is a sample of our capabilities and solutions:
- Assist with building data models across multiple systems and data sources for use in analytical reporting.
- Domain expertise – understand KPIs that are applicable to your business across the energy supply chain.
- Use of Power BI to assist with data conversion efforts.
- Develop Power BI visualizations that can be deployed in the organization as dashboards, apps, etc.
- Support business and IT resources on initiating or enhancing Power BI and other BI projects.
Related Insights


Our experts are here
for you.
When you choose Opportune, you gain access to seasoned professionals who not only listen to your needs, but who will work hand in hand with you to achieve established goals. With a sense of urgency and a can-do mindset, we focus on taking the steps necessary to create a higher impact and achieve maximum results for your organization.
LeadershipGeneral Contact Form
Looking for expertise in the energy industry? We’ve got you covered.
Find out why the new landmark legislation should provide a much-needed boost for the development of carbon capture.