GIS Solutions: How Visualization Optimizes Data Analysis

Chances are you’ve used a geographic information system (GIS) mapping system before. Google Maps or the maps application on your phone are web-based mapping platforms used typically for navigation purposes. GIS has many more advanced uses. GIS can capture, store, manipulate, and visualize spatial data that helps cities, counties, and industries reveal spatial relationships through analysis and real-world data visualization. As the world becomes more data-driven, the benefits and abilities of GIS are helping companies make quicker informed decisions with a real-time perspective.
One of the key components to the visualization aspect of GIS is the scale at which the data is viewed. The scale of a map is determined by the source data or the level of detail one needs to show to accurately display information. They’re typically broken out into two categories: large scale and small scale.
Large-scale maps display a smaller area with a greater amount of detail (think of a map of your neighborhood or a small town). Small-scale maps display a much larger area with less detail (think of a map of a country or an entire hemisphere). Both are beneficial to displaying and analyzing data to fit the scope of your project.
Below are a few examples of oil and gas-related geospatial data and the benefits we gain from visualizing this data from different perspective scales.
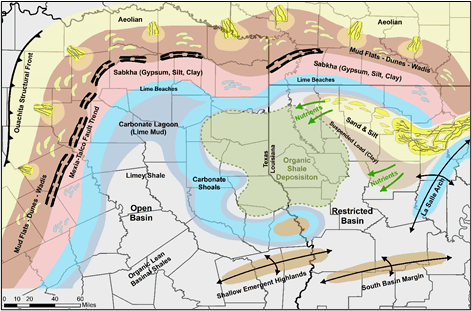
Haynesville Basin Shale Map: Small Scale (1:2,022,745)
The map below shows the Haynesville Basin geologic shale overview with RED acreage position overlayed. We can quickly identify which areas of our acreage position yield the most potential value on a basin-wide scale through this visualization. From here, one can move onto adding more detail to the desired ownership areas in productive regions.
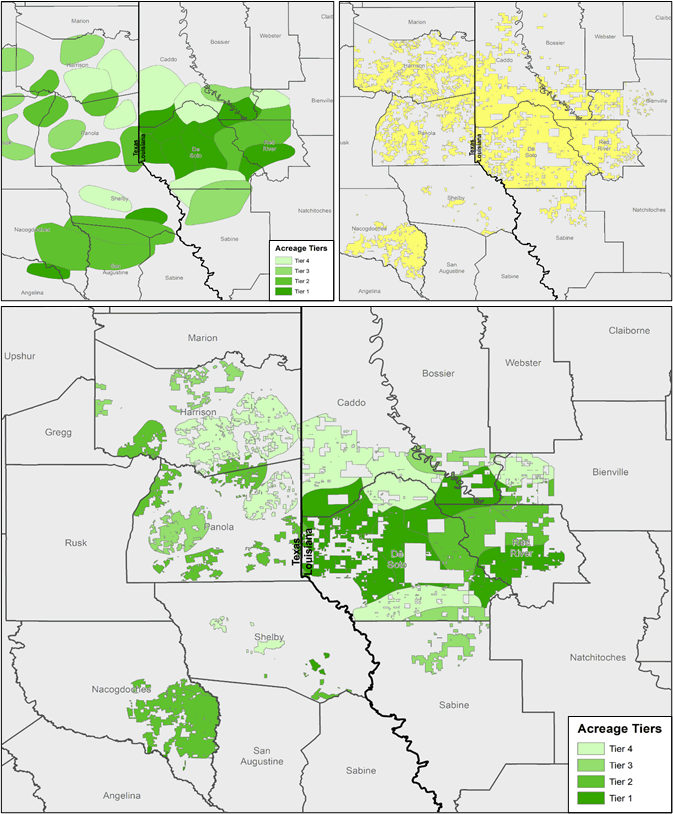
Haynesville Tiers Map: Intermediate Scale (1:982,626)
Continuing a step further, we can view our acreage overlayed with acreage tiers for the basin. Not only is there a visualization for which tiers our acreage overlaps, but analysis can also be done to break apart our acreage into each tier and calculate the number of acres contained within each. Net revenue interest (“NRI”) or working interest percentage (WI%) can be inputted into this as well to generate a quick and rough value estimate of the land.
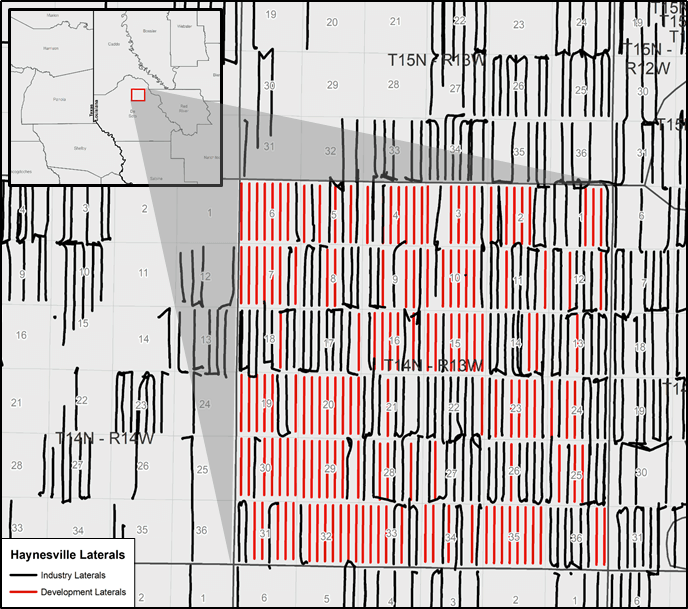
Haynesville Lateral & Development Map: Large Scale (1:84,652)
While small-scale basin-wide maps don’t paint the whole picture, they’re the foundation to the entire story. Large-scale maps divulge much more detail and allow visualizations for real-world decisions to be data-driven. This map scale allows for spacing metrics to be calculated and potential well development to be visualized and can be used for spatial data to be tied together and create an in-depth look/analysis on a specific oil and gas lease.
The map scales above provide a quick and easy way to interpret real-time data. The value of visualizing data at a basin-wide, statewide, or township-wide scale allows for informed decisions to be made quickly with confidence. In today’s fast-paced world where people get their news and media from tweets limited to 180 characters, the ability to accurately display data that can be quickly interpreted and understood is more valuable than ever.
RED has extensive experience in developing and delivering added value through geospatial and GIS services that fit unique client needs. For more information, CLICK HERE.
Related Insights


Our experts are here
for you.
When you choose Opportune, you gain access to seasoned professionals who not only listen to your needs, but who will work hand in hand with you to achieve established goals. With a sense of urgency and a can-do mindset, we focus on taking the steps necessary to create a higher impact and achieve maximum results for your organization.
LeadershipGeneral Contact Form
Looking for expertise in the energy industry? We’ve got you covered.
Find out why the new landmark legislation should provide a much-needed boost for the development of carbon capture.